How about using the elevation data instead of the topographic contour lines, and generate the contour lines on demand?
You might need to resample the topographic data available, to get a regular rectangular grid. A regular rectangular grid is ugly, but I'm not suggesting that; the end result would be a triangular/hexagonal grid, see below. If the distance between height samples is L, you can use a regular rectangular grid cells L wide and 2Lsin60° ≈ 1.732L tall (or vice versa); just have one sample at the corner of the cell, and one at the center. A 16-bit unsigned integer would work -- either feet, or thirds of a meter, so you can cover everything from Mariana Trench to top of Mount Everest -- so that'd be 4 bytes per 1.732L2, or about 2.31 bytes per L squared. Given that the total surface area of the Earth is about 510,072,000 km2, the dataset is about 1.1GiB at 1km resolution. Only 30% of that is land, however. I'd probably go for something like 20-30 meter resolution; should be enough for hiking.
Within each triangle, using data from one, two, or three cells, you can interpolate the height at given point trivially, because the relative distances to the three defining points are always constant. (I can derive the exact equations, if you like.)
Furthermore, you can draw any contour curve or curves you want. Within each triangle, there can be at most one line belonging to a topographic contour curve.
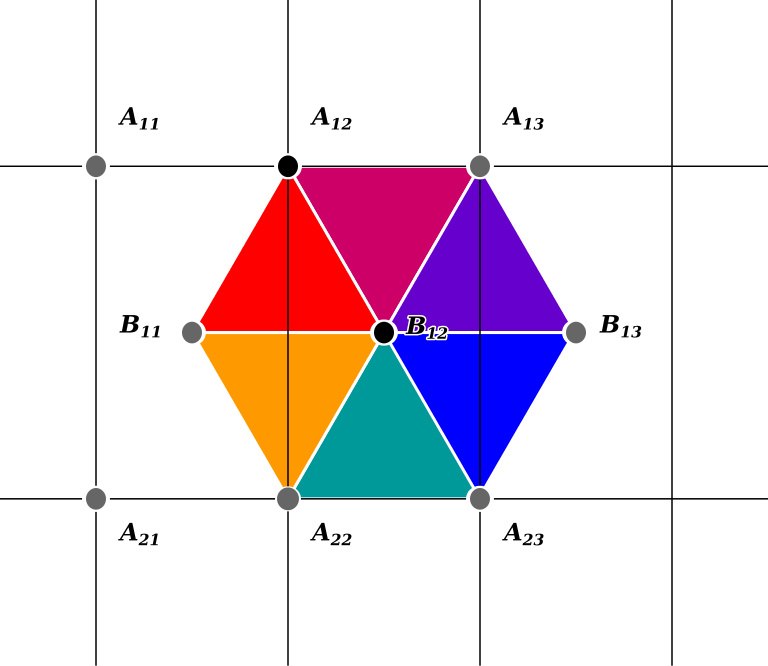
Consider the leftmost, red, triangle above. It is defined by three points: corner point of cell (1,2), A12, and center points of cells (1,1) and (1,2), B11 and B12 respectively. The center cell in the above image is cell (1,2). If one or two of those points are at or below the contour curve, and one or two is above the contour curve, then the curve passes through this triangle, and is approximated by a line. Let's say that C is our contour level -- remember, we can pick these freely (which might come in very handy when hiking, and considering different paths, if the data was detailed enough) --, and that
A12 ≤ C
B11 > C
B12 > C
then we know for a fact that the contour line crosses the triangle sides A12B11 and A12B12. You can trivially compute the intersection points using linear interpolation:
t1 = (C - A12) / (B11 - A12), 0 ≤ t1 < 1
t2 = (C - A12) / (B12 - A12), 0 ≤ t2 < 1
If the 2D coordinates for the points are PA12, PB11, and PB12, then the contour line is drawn between P1 and P2,
P1 = (1 - t1) PA12 + t1 PB11
P2 = (1 - t2) PA12 + t2 PB12
There are a total of six cases how the contour line might intersect the triangle, plus another six cases where the contour line is an edge of the triangle (because two were equal to C and the third was not), but it's all symmetrical to above.
If you rotated the display, only the PA12, PB11, and PB12 are rotated above -- and since they are just the regular rectangular grid points (corner and center points), they can be trivially derived just from your orientation and relative position.
If you had a color display, many microcontrollers are fast enough to calculate the interpolated elevation at every pixel in any orientation or scaling if you use a regular rectangular grid, but for contour lines, you definitely want the center point too, to make the contours look more natural.
If you draw more than one contour line, as in the video displayed, do note that there often are more than one contour line within each triangle. The restriction here is that a single contour line only passes through a triangle once; every contour line you have could very well pass through the same triangle. So the resolution you should target is basically determined by how precise data you can get your mittens on, and how much storage you can devote to it.
For example, if B12 was the highest elevation compared to the six surrounding points, you'd have a six-sided polygon around it, approximating the contour.
For different zoom levels, just store additional datasets with L doubled every step. You only need at most 1/3 more storage space (1/4 + 1/16 + 1/64 + 1/256 + ... ≤ 1/3).
It would also make sense to clip all paths to sub-paths that fit within a cell. That way all your path considerations are limited to sub-paths in four cells or fewer (to consider everything closer than L/2), or eight cells or fewer (to consider everything closer than L).
A full planetary map could start with an icosahedron (20-sided regular polyhedron with triangular faces), then recursively subdivide each triangle into four sub-triangles, down to desired detail. (Yes, you can use this approach to specify a direction or position on a spherical shell using a single integer, at arbitrary precision.) In this case, you'd have for example average elevation stored for each triangle. Unfortunately, the calculations between subdivided icosahedral coordinates and standard latitude-longitude coordinates are so nasty I don't think anyone has seriously even considered this approach. The nice thing in this approach with relation to Earth is that there are several orientations in which land masses are nicely contained within the triangles, and even on the highest level, the distortion between a flat triangle and the spherical surface is very small; nothing like for example a Mercator projection, which is ridiculously stretched.
If anyone is interested in the math involved here, I'd be happy to elaborate. I had a hobby project in late nineties involving elevation data and contour curves for Pyhä-Luosto National Park, but at that time, the elevation data was not freely available in Finland. In fact, just the elevation data for the region involved would have cost the price of a new computer. So that was that. I did scan some maps, extracted the contour curves, but the ensuing reconstructed elevation data was unnatural; it'd have needed serious filtering to make it resemble the actual data (some erosion modeling, maybe?). Or maybe my home-grown data extraction functions were just incorrect.. 


